
Growers have long controlled greenhouse climate by temperature and relative humidity, but plants respond to something more specific: the drying power of the air. Vapour pressure deficit, or VPD, measures how much moisture the air could still take up at its current temperature. It is the most direct measure of the force pulling water out of a leaf, and so it is a better guide to plant transpiration than humidity alone.
This article explains how VPD is calculated, why it matters more than humidity in a controlled environment, what target ranges are commonly used, and how to build a reliable automated control loop around it. The worked examples can be checked with a calculator, and the advice on sensors and calibration applies to any microcontroller platform.
1. Calculating VPD
VPD is the difference between the saturation vapour pressure of the air and the actual vapour pressure. Saturation vapour pressure rises steeply with temperature, so warm air holds far more moisture than cold air at the same humidity. A widely used approximation, the Tetens formula, gives the saturation vapour pressure in kilopascals as 0.6108 multiplied by the exponential of 17.27 times the temperature in degrees Celsius, divided by the temperature plus 237.3. It appears in standard environmental physics references, such as Monteith and Unsworth's Principles of Environmental Physics, where it is stated to agree with exact values to within 1 Pa up to 35 degrees Celsius. The actual vapour pressure is that saturation value multiplied by the relative humidity as a fraction.
A worked example makes this concrete. At 22 degrees Celsius, the saturation vapour pressure is about 2.65 kilopascals. At 60 percent relative humidity, the actual vapour pressure is 1.59 kilopascals, so the VPD is about 1.06 kilopascals. The same 60 percent humidity at 30 degrees Celsius would give a much larger deficit, roughly 1.7 kilopascals, which would pull water out of the plant far faster. Humidity alone hides that difference, which is why VPD is the better control variable.
2. Why VPD Predicts Plant Behaviour
Plants regulate their water loss through stomata, small pores on the leaf surface. When VPD is too low, the air is almost saturated, transpiration slows, and nutrients carried in the water stream move more slowly through the plant. When VPD is too high, the leaf loses water faster than the roots can supply it, and the plant closes its stomata defensively. Both extremes reduce growth, and both are visible in the plant long before a sensor reading looks alarming.
Between these extremes is a band where stomata are open enough to carry nutrients and carbon dioxide, but not so open that water stress builds. Target ranges are usually given as a band rather than a single number, and they vary by crop and growth stage. Many vegetative crops are commonly managed in a band around 0.8 to 1.2 kilopascals, and flowering crops are often allowed somewhat higher. Seedlings and cuttings are kept lower, but the recommended figure varies between sources: some guides give 0.4 to 0.8 kilopascals, others lower still. There is no single published standard for every crop, so these ranges come from horticultural practice rather than one authoritative study. Confirm the band for the species and stage you grow, and adjust it against how the plants actually look.
Figure 3.1 (Illustrative): Target VPD Band Across Growth Stages
Illustrative target bands, not a published standard. Shaded areas show where a grower might aim at each stage, with lower values for seedlings. Confirm the band for your own crop, because the correct range differs between species.
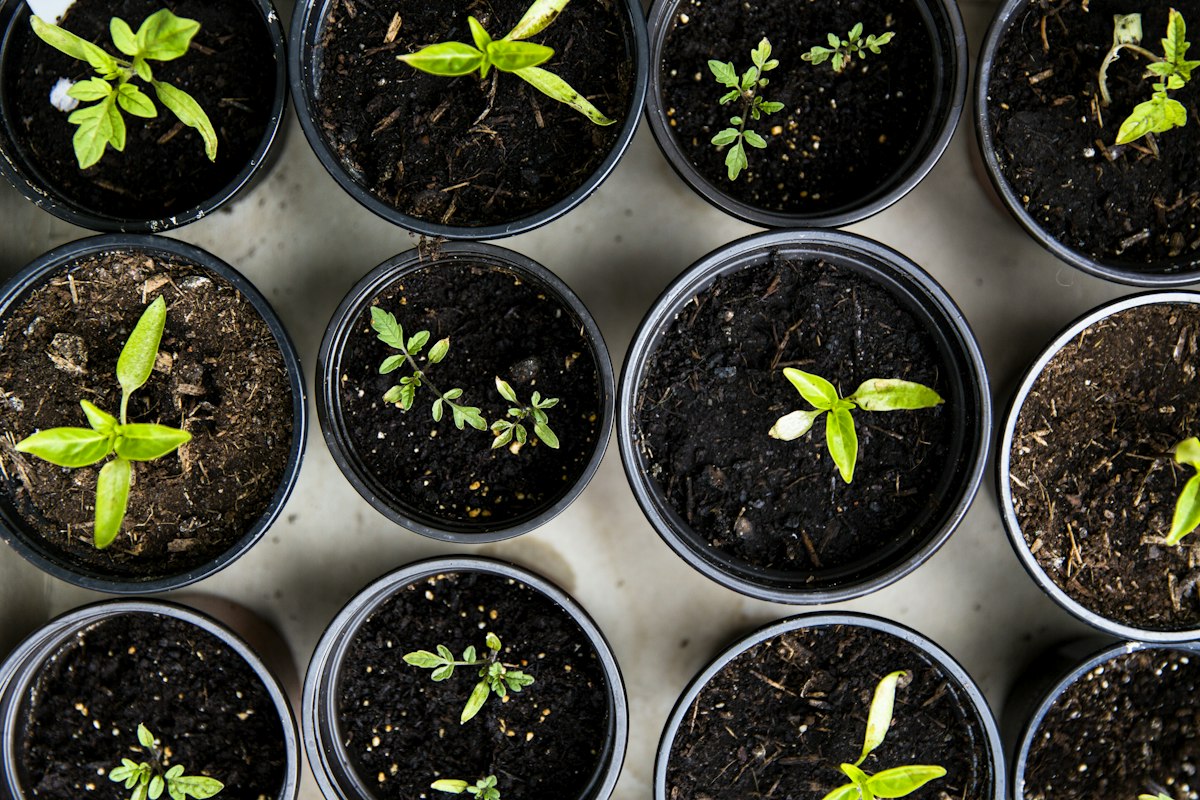
Plant condition is the final check on any climate controller. Leaf colour, growth rate and pests are signals no sensor fully replaces.
3. Building the Control Loop
Automating VPD means reading temperature and humidity, calculating VPD, and switching equipment such as exhaust fans and humidifiers to move the reading towards the target. An ESP32 microcontroller with a digital I2C sensor, such as a common SHT-series temperature and humidity module, is a practical base for this. The sensor reports values over a simple two-wire bus, and the microcontroller runs the calculation and the control logic.
The most important design choice is hysteresis, a deliberate gap between the switch-on and switch-off points. Without it, a fan or humidifier that reaches the target will turn on and off rapidly around the same value, wearing out the relay and making the climate unstable. A typical approach is to start venting when VPD rises above the upper limit of the band, and stop once it falls back to a value somewhat below that limit. The gap should be wide enough to prevent rapid cycling but narrow enough to hold the band.
4. Sensor Placement and Calibration
A sensor placed in the wrong location will produce a reliable-looking number that does not describe the plants. It should sit at canopy height, in shade, and away from the direct spray of a humidifier, where the air is locally saturated and the reading will be wrong. Placing it near the vents or the heater also gives a misleading value, so it should be where air moves through the crop rather than where it leaves the building.
Humidity sensors drift over time, so they should be checked. A simple test uses a saturated salt solution. Common table salt mixed with a little water, kept with the sensor in a sealed bag or box, produces a relative humidity of about 75 percent at room temperature. The result depends on the setup: the salt must be wet and in excess, the container must be sealed, the temperature should stay stable, and the sensor needs several hours to settle, with six to eight hours being a common recommendation. If the sensor reads far from that figure once it has settled, it needs recalibration or replacement. Repeat the check periodically, especially after a sensor has been exposed to condensation.
Figure 3.2 (Illustrative): Transpiration Rate Against VPD
Illustrative curve showing the general relationship described in the text, not measured data. Transpiration rises with VPD, peaks in the working band, then falls as stomata close defensively at high deficit. Dashed line: the response of a plant in more severe stress.
5. Logging, Alarms and Fail-Safes
Automation should fail safely. If a sensor stops responding, the controller should fall back to a conservative default, such as ventilating at a fixed rate, and send an alert rather than continuing to act on a stale reading. A log of temperature, humidity and VPD at regular intervals is the most useful diagnostic tool in the system, because it shows slow drift and recurring problems that a single reading would miss.
Finally, keep manual override available. The controller is a tool for holding a band, not a replacement for walking the greenhouse and looking at the plants. Leaf condition, growth rate and the presence of pests are signals that no sensor can fully replace.